|
Cosmic Web
(670 Mb) -- Fly-through animation of the WISE-G12 cosmic web, featuring the clustering and filamentary web of galaxies.
This is a very large, high-fidelity movie.
|
|
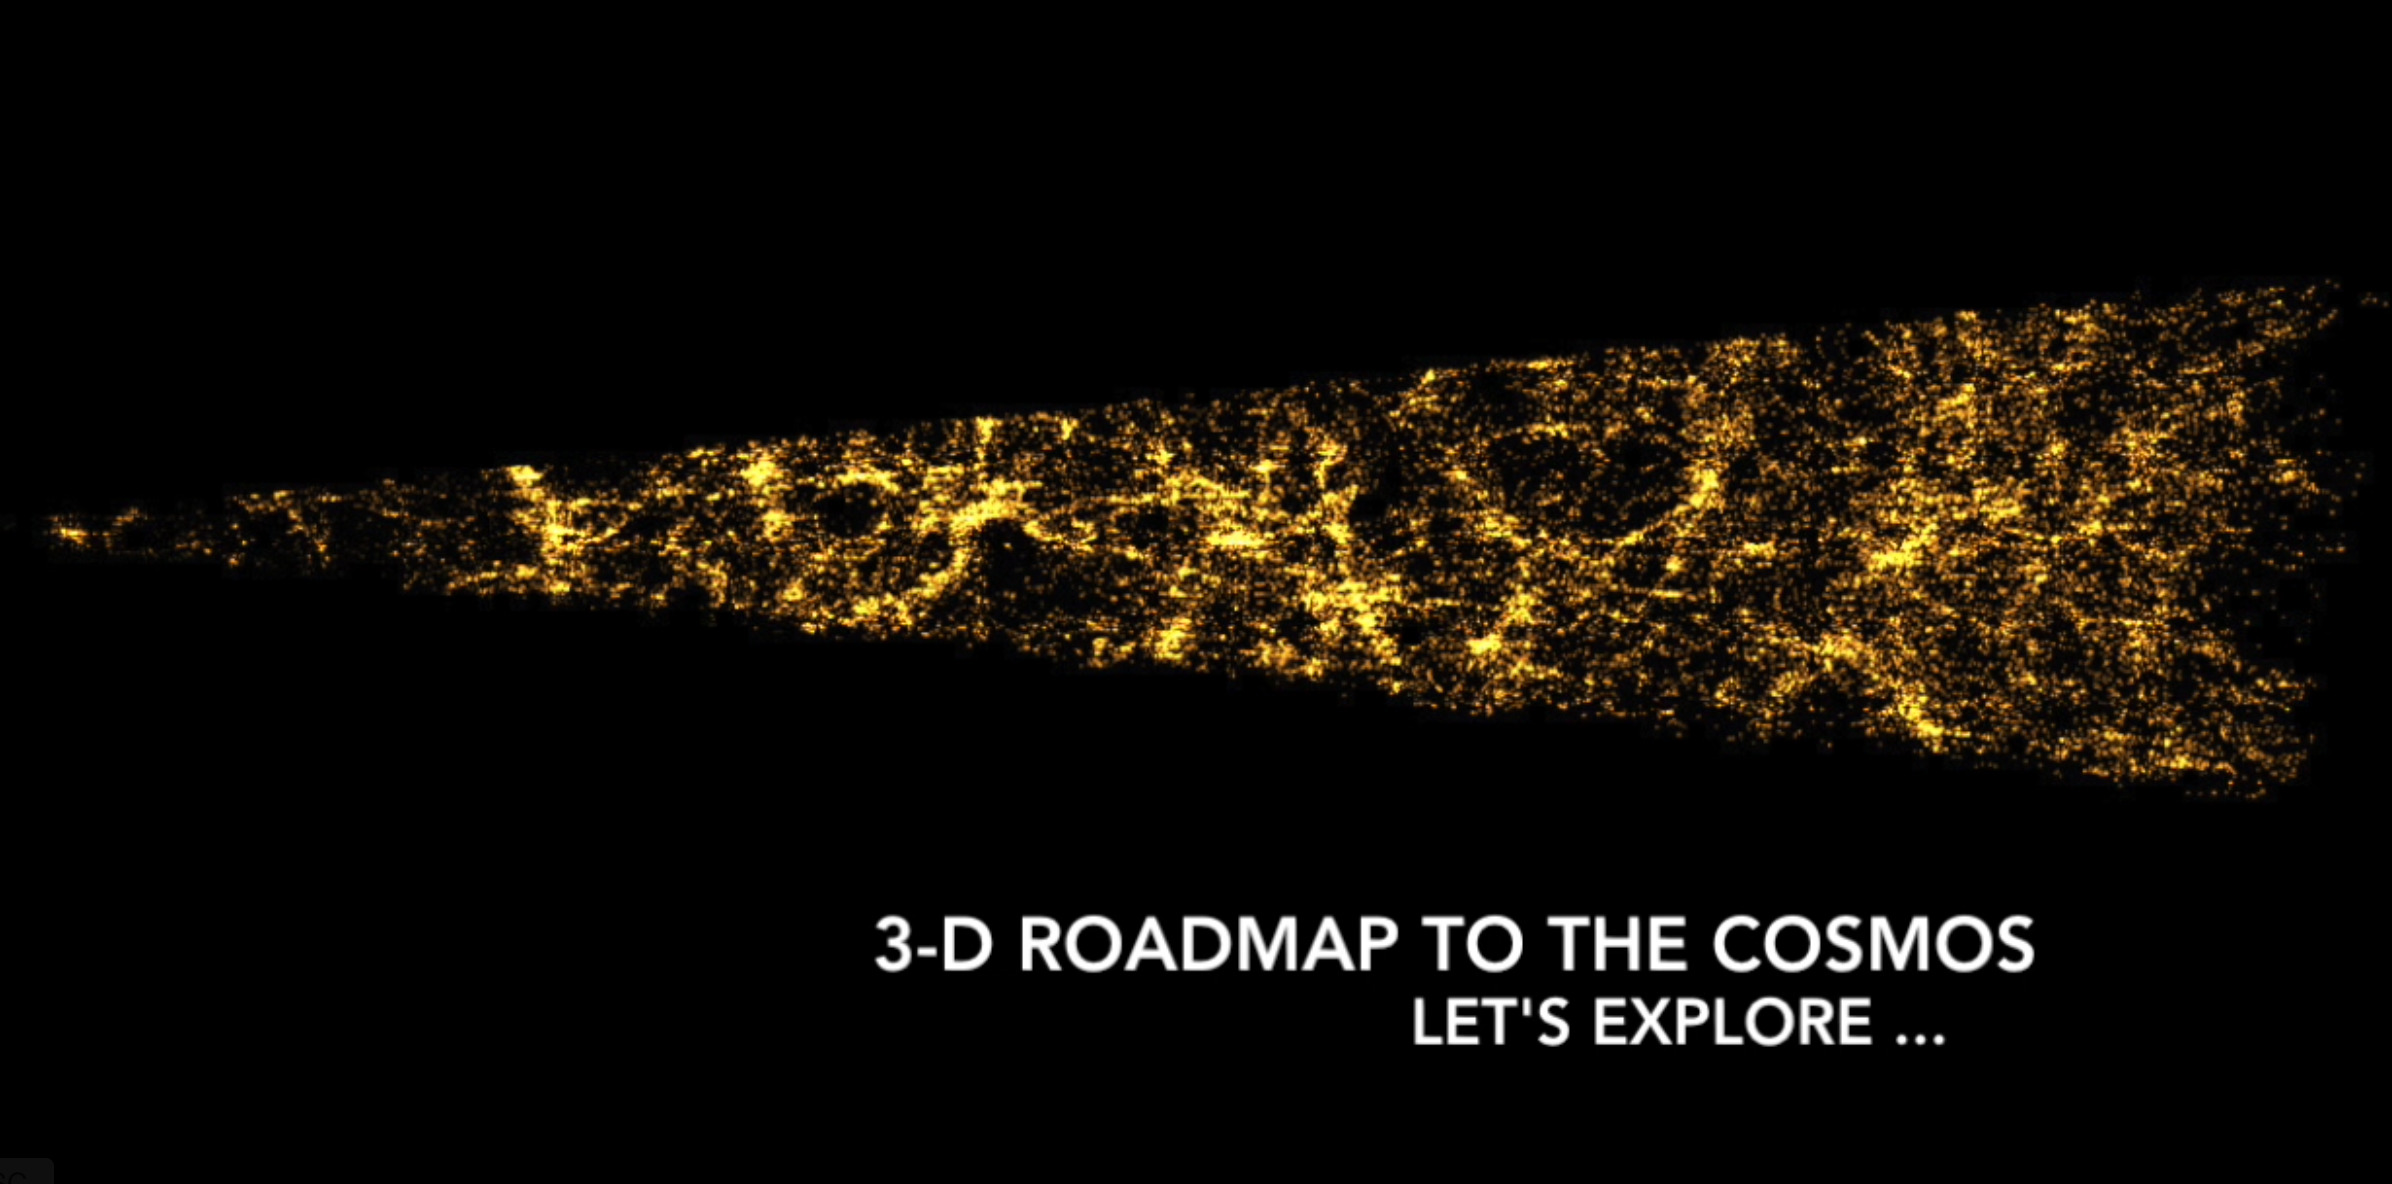
Large Scale Structure
(50 Mb) -- Fly-through animation of the WISE-G12 cosmic web, featuring the clustering and filamentary web of galaxies.
|
|
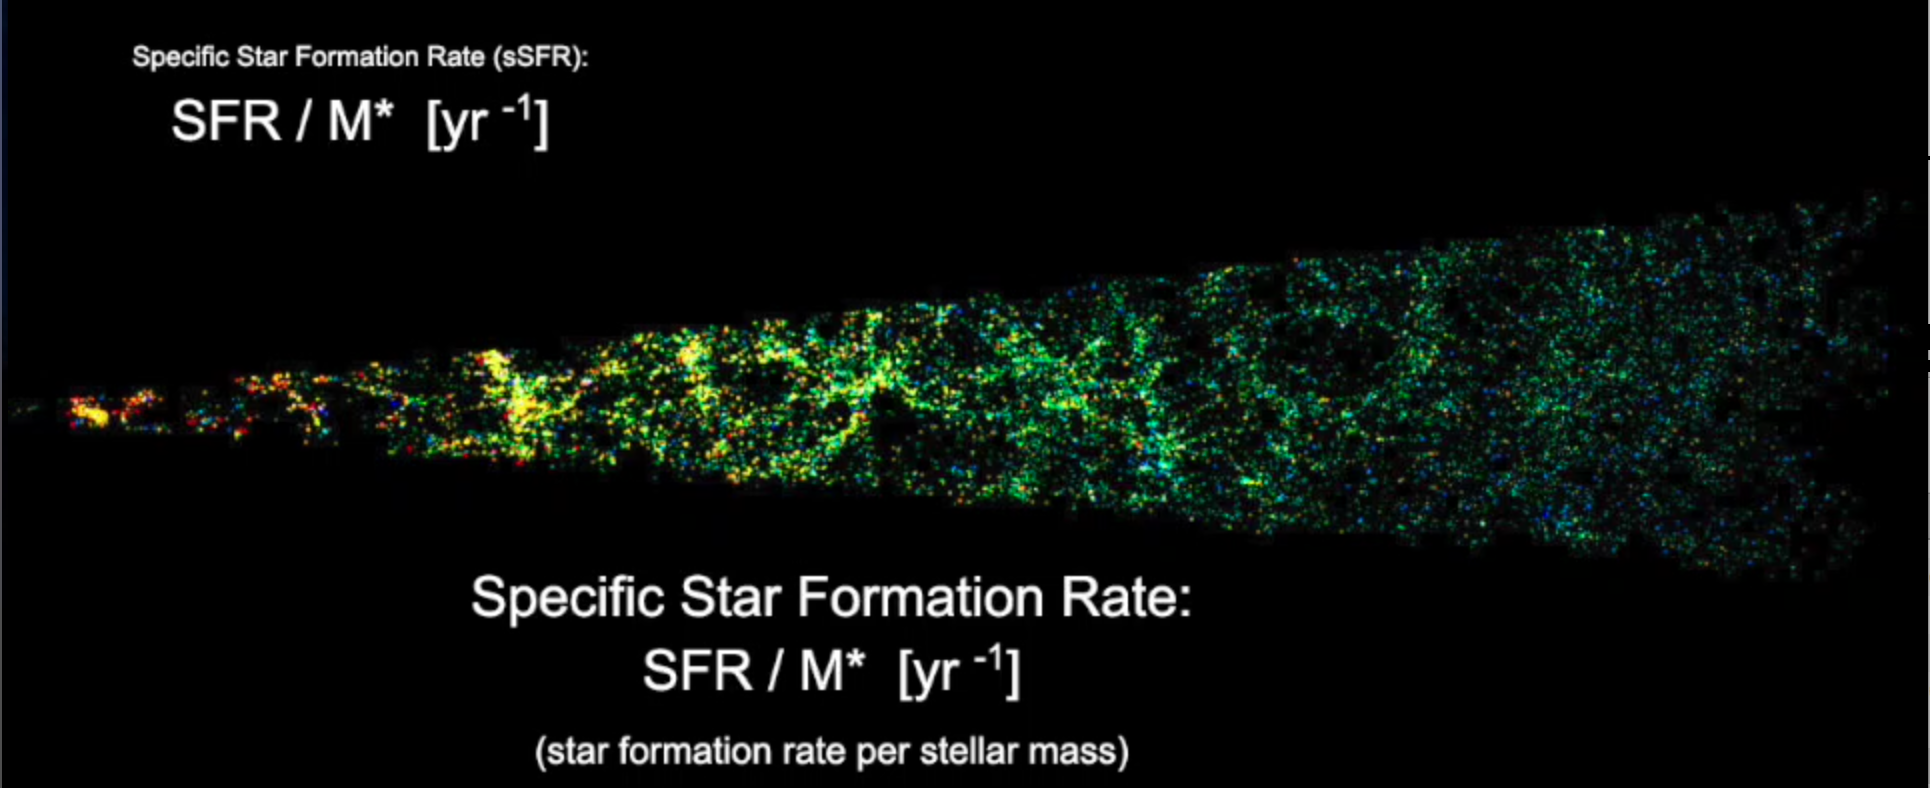
Star Formation History
(64 Mb) -- Fly-through animation of the WISE-G12 cosmic web, featuring the Star Formation Rate per host (galaxy) mass.
|
|
Galaxies, Young and Old
(75 Mb) -- Fly-through animation of the WISE-G12 cosmic web, featuring galaxy morphology.
|
|
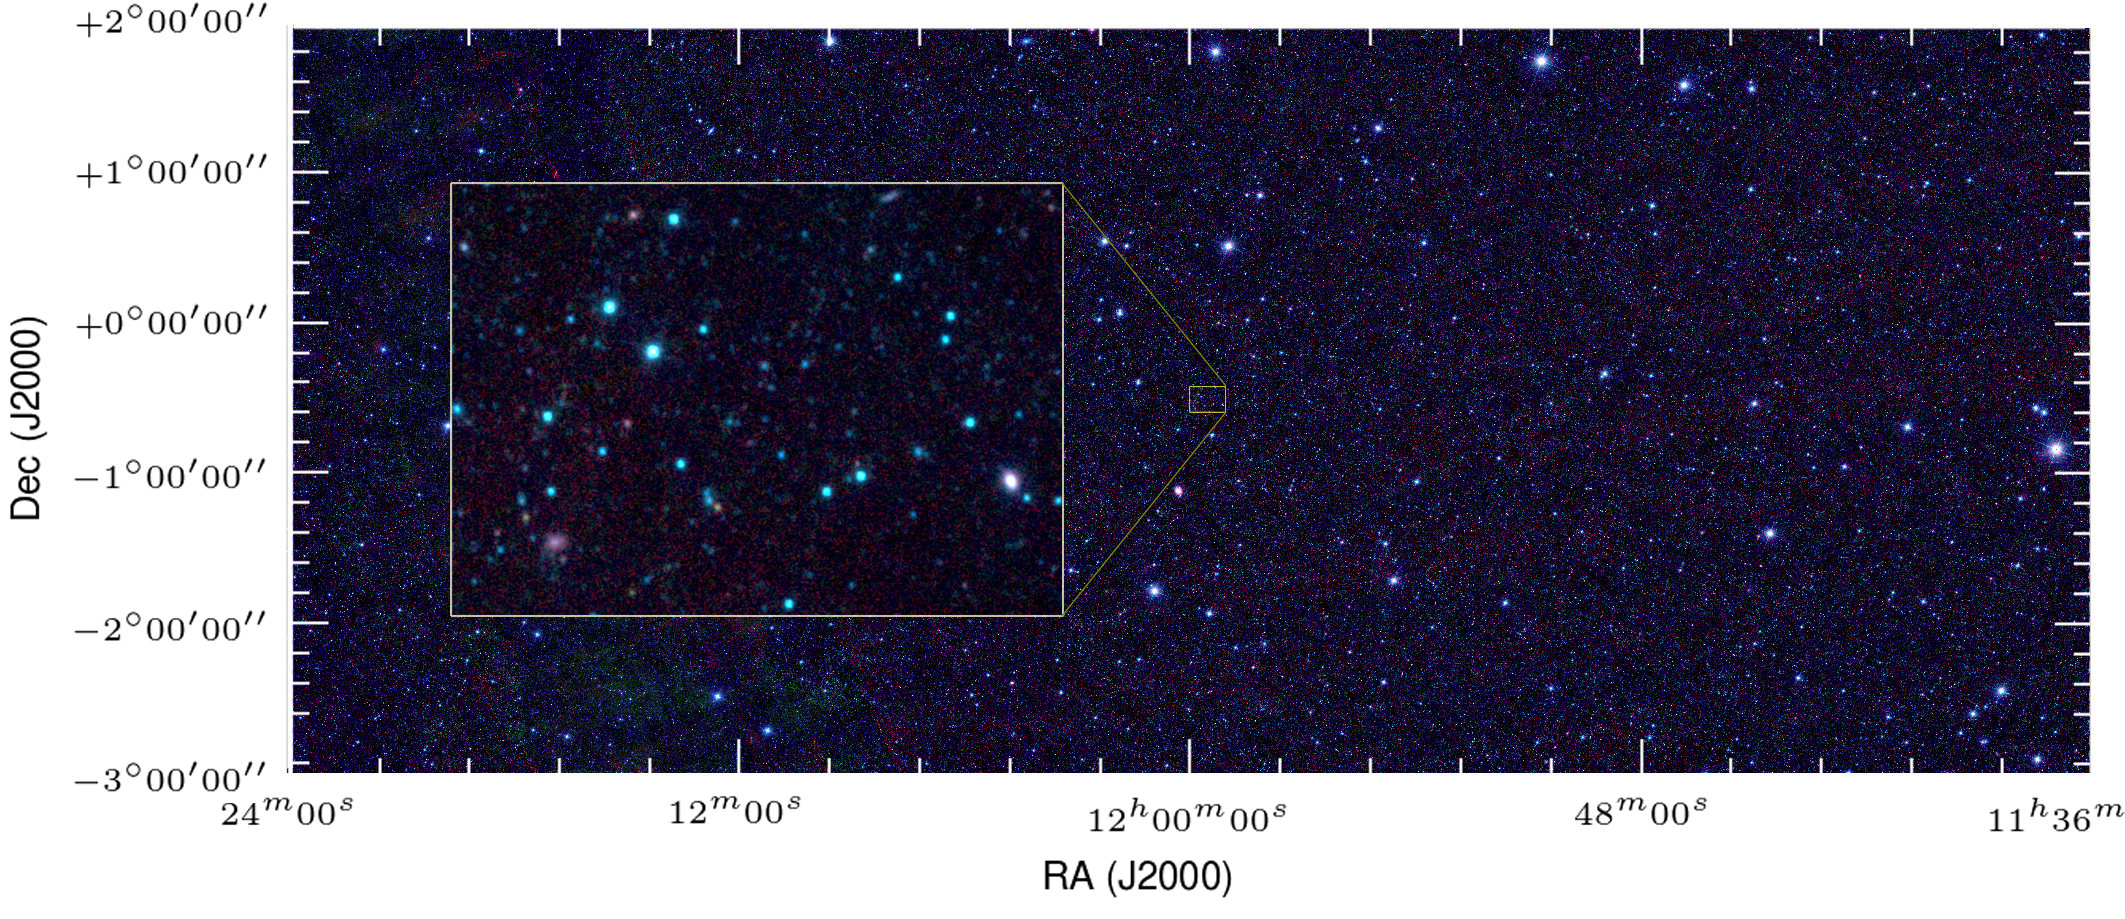
In combination with cosmological redshifts, we identify galaxies from their WISE W1 3.4 um extended emission,
and by performing a star-galaxy separation using apparent magnitude, colors and statistical modeling of star-counts.
The resultant galaxy catalog has ~600,000 sources in 60 deg^2, reaching a W1 5-sigma depth of 34 uJy.
At the faint end, where redshifts are not available, we employ a luminosity function analysis to show that a
substantial fraction are sources at high redshift, z > 1.
The spatial and radial distribution
is investigated using two-point correlation functions and a 3D source density characterization at
5 Mpc and 20 Mpc scales. For angular distributions, we find brighter and more massive sources are
strongly clustered relative to fainter and lower mass source; likewise, based on WISE colors,
spheroidal (early-type) galaxies have the strongest clustering, while spiral/disk (late-type)
galaxies have the lowest clustering amplitudes. Along the radial direction, the strongest clustering
is in the largest redshift shell, while the weakest is in the nearest redshift shell, consistent
with the stellar mass and morphological type dependency results.
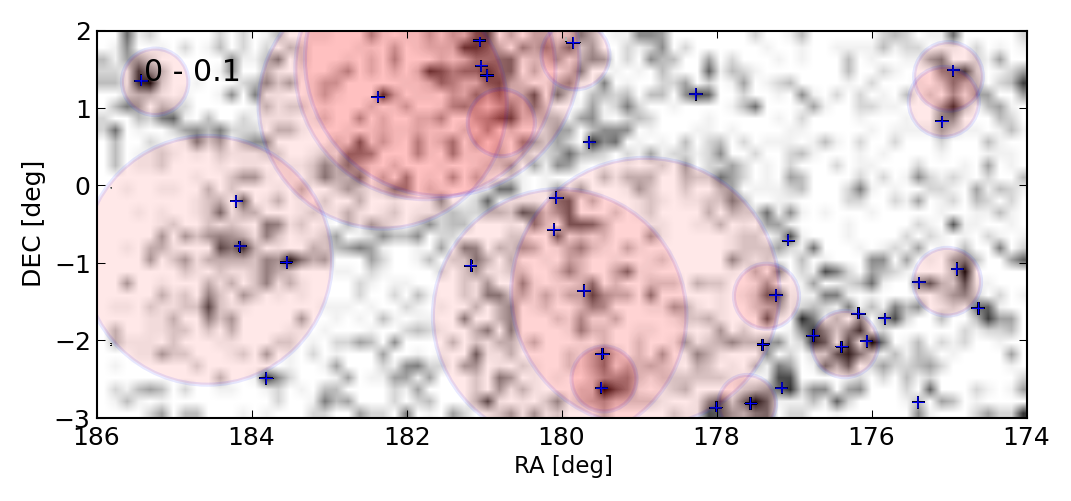
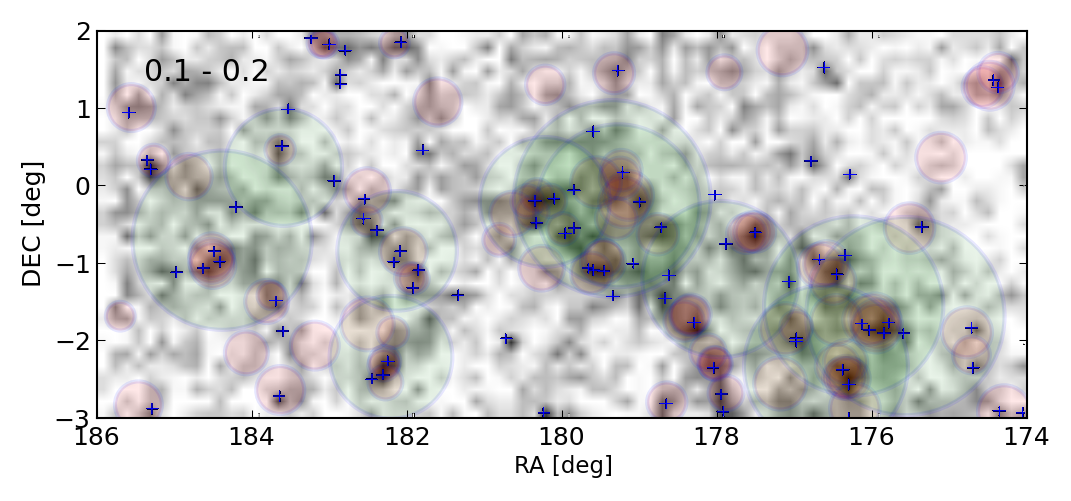
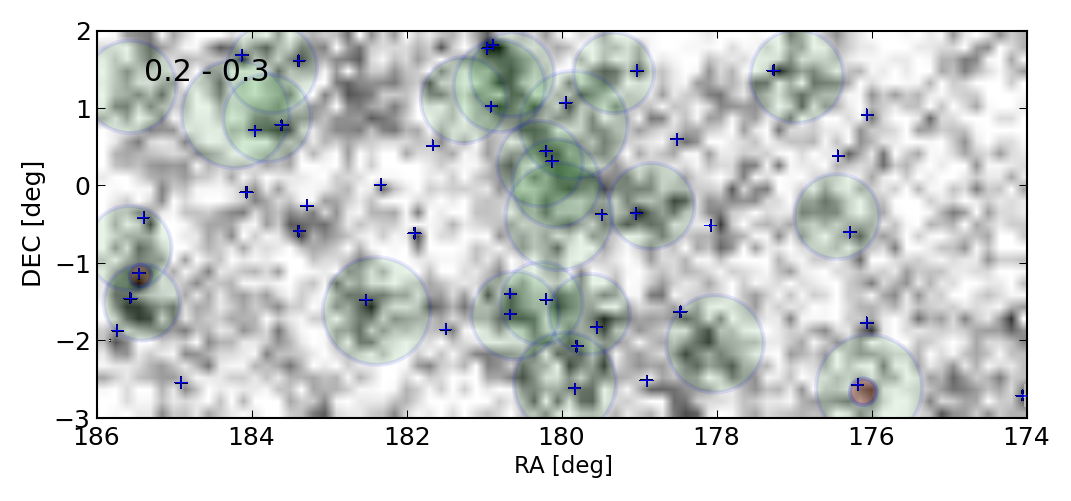
In three dimensions, we find a
number of distinct groupings, often bridged by walls and super-structures; using special visualization
tools, we map these structures, exploring how clustering may play a role with stellar mass and galaxy morphology.
|
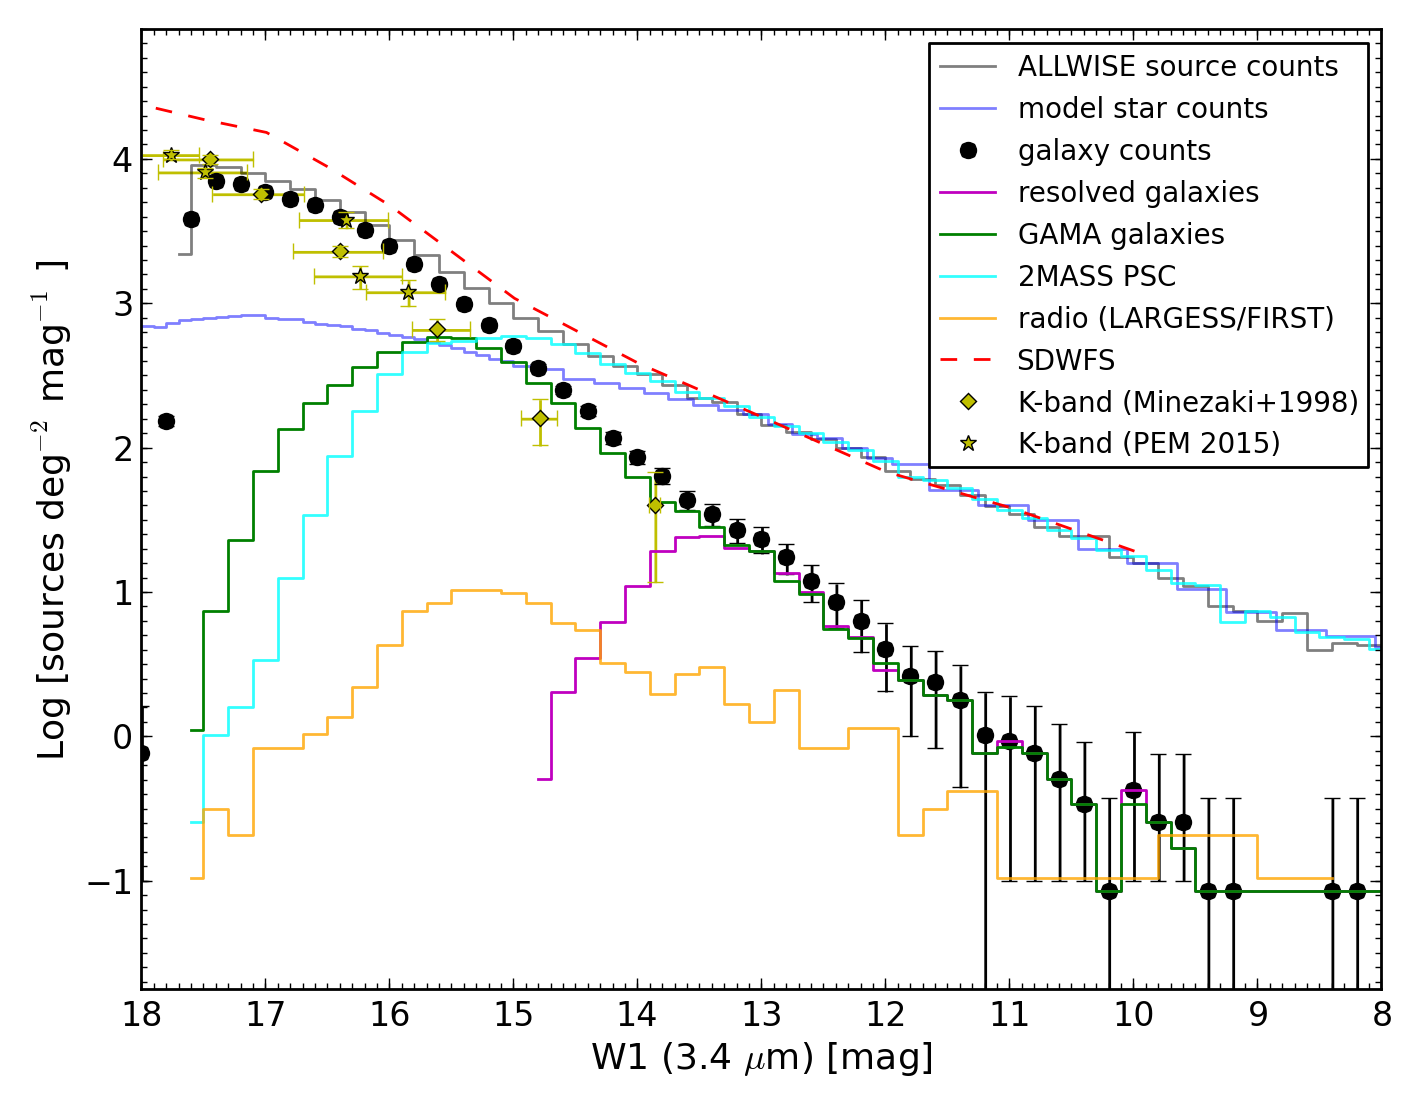
Final differential W1 (3.4um) source counts in the G12 region. The total galaxy counts are denoted with solid black circles and Poisson error bars. {\it WISE} sources that are also GAMA (green), resolved (magenta), 2MASS PSC (cyan) and LARGESS radio galaxies(orange) are indicated. For comparison, we show deep IRAC-1 counts from the Spitzer Deep-Wide Field Survey, deep K-band galaxy cunts, rest frame-corrected to the W1 channel, from the Minezaki et al. (1998) and Prieto & Eliche-Moral (2015) studies.
|
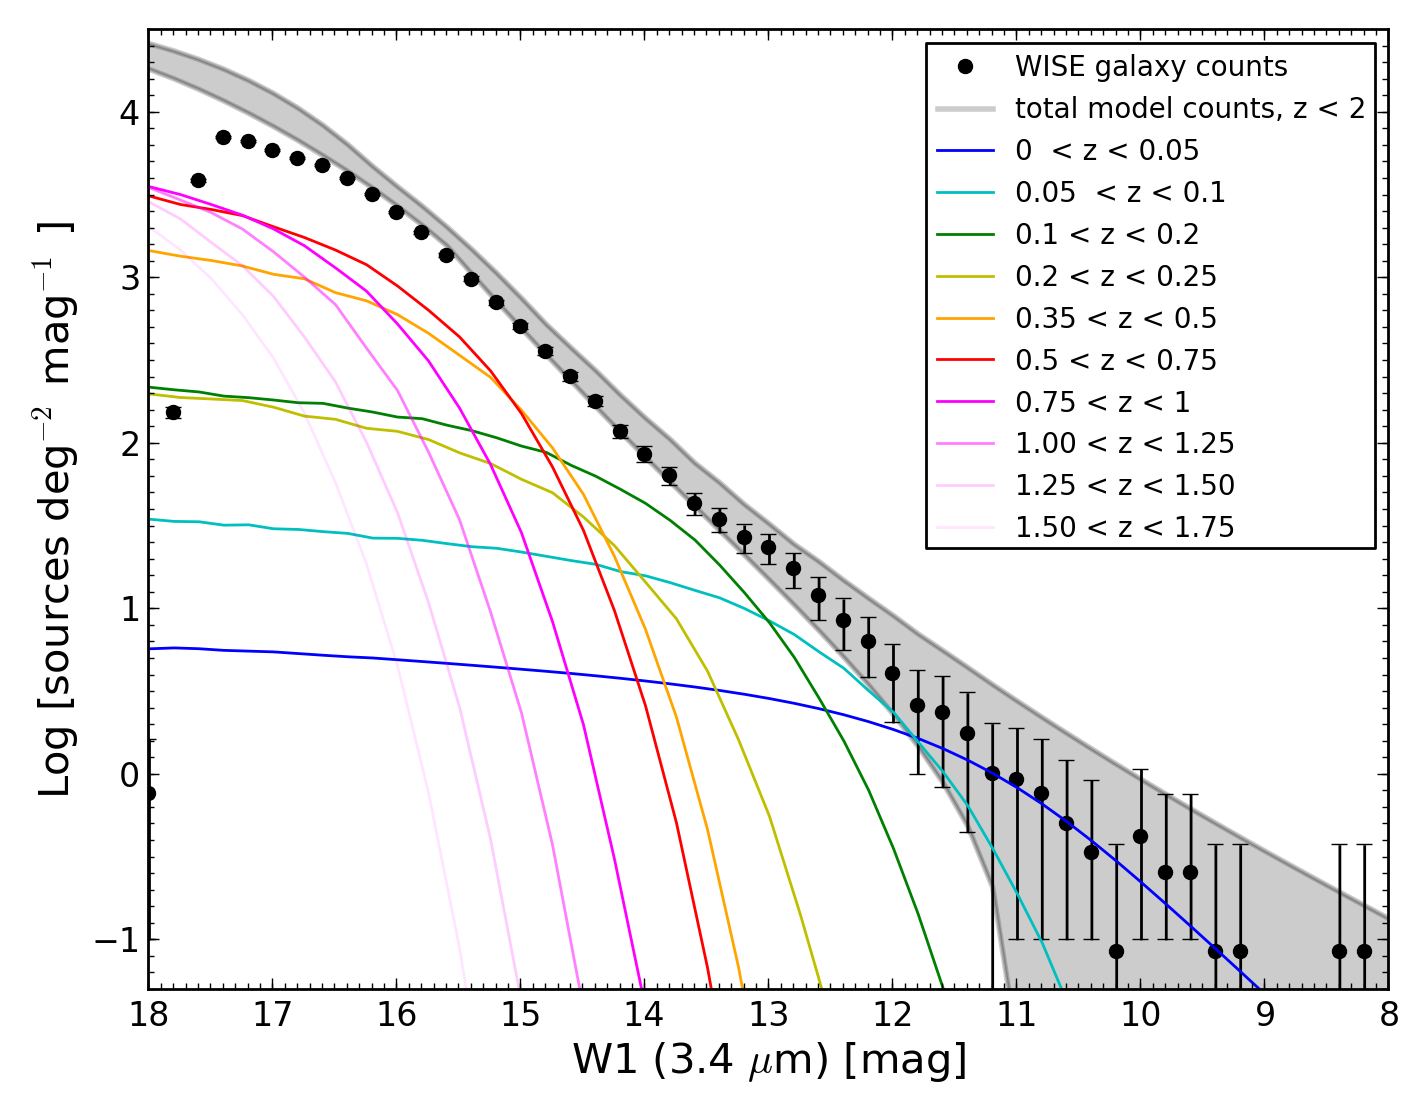
Expected extragalactic source counts: differential source counts in comparison to the measured WISE values(solid filled points), highlighting a series of redshift shells.
The shaded curve represents the spread in values using a mixture of k-corrections and two different infrared LFs of Dai+09.
|
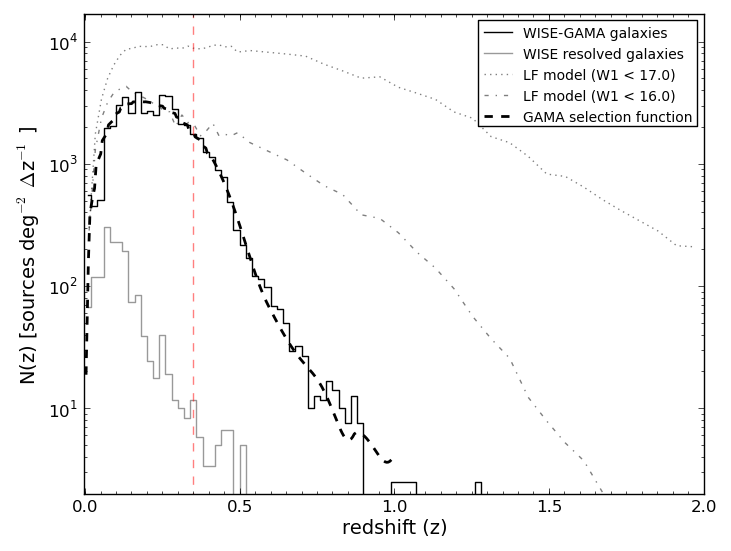
Redshift distributions of the real and expected G12 sources; (a) Denoting all GAMA matches (solid line) and those that are resolved in WISE (grey line). The derived N(z) function is shown with a dashed line, and used later as the selection function in the 2PCF analysis; also shown are the expected (model-averaged) distributions at magnitudes (W1 = 16 & 17 mag) fainter than the GAMA detection limit.
|
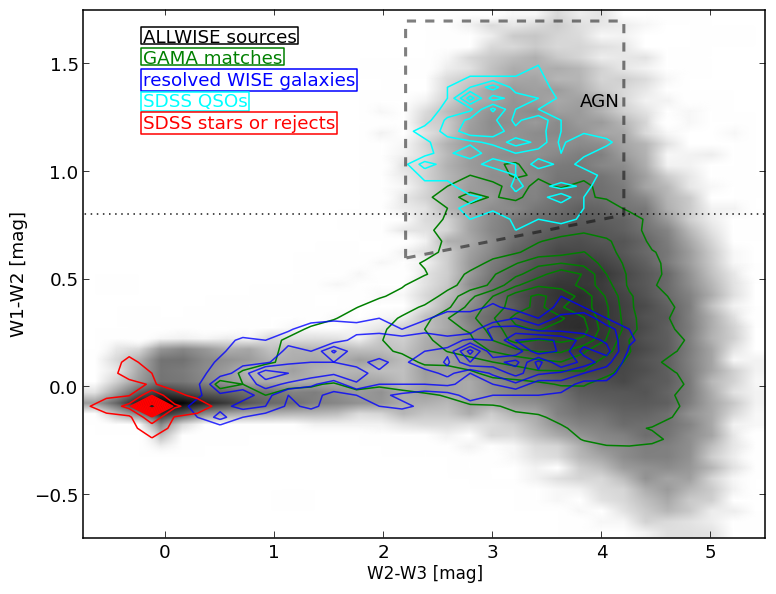
Color-color diagram for G12 detections: (a) W1-W2 vs W2-W3, and (b) near-infrared J-W1 colors.
Different populations are indicated: the greyscale shows all WISE sources; GAMA matches are shown with green contours; resolved galaxies with blue contours; SDSS QSOs with cyan; stars or otherwise rejected sources are in red.
|
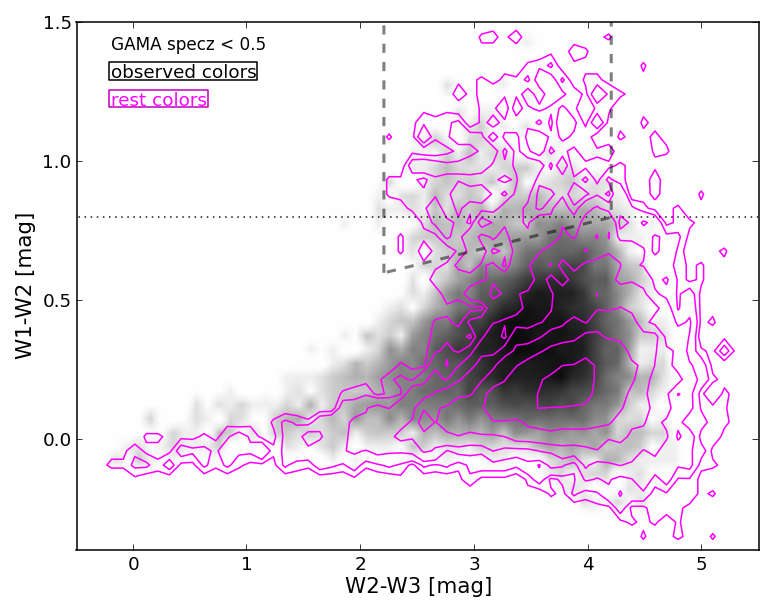
WISE mid-infrared colors. (a) Color-color distribution of galaxies, comparing their observed and rest frame-corrected rest measurements. The corrections are such that the WISE W1 and W2 magnitudes appear brighter with redshift, shifting the ensemble towards the upper left. The horizontal dashed line is the AGN threshold from Stern et al. (2012), and the dashed lines denote the QSO/AGN zone from Jarrett et al. (2011).
|
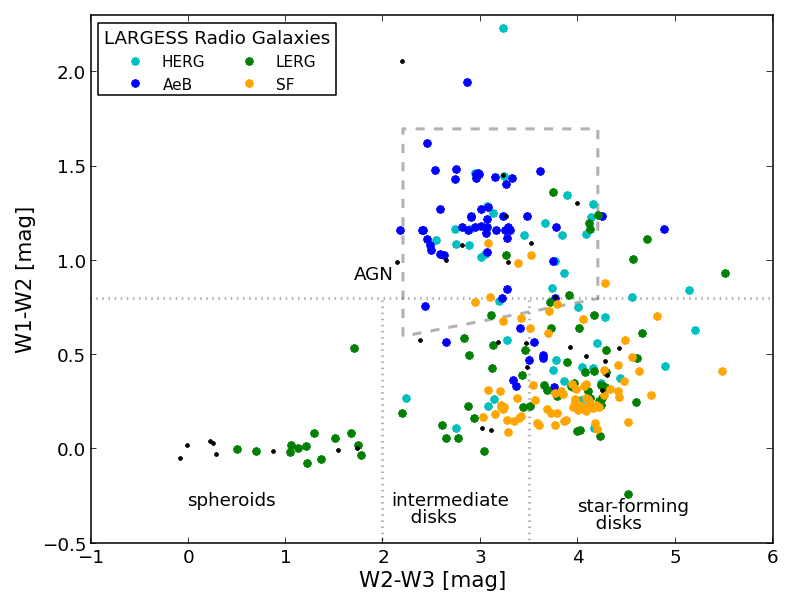
Radio galaxy colors in the WISE W1-W2-W3 diagram. Radio galaxies from the LARGESS (Ching et al. 2016) are delineated by their spectroscopic properties, including those with high-excitation lines (HERGs), weak or low-excitation (LERGs), those specifically with broad emission lines (AeBs), and with dominant star formation properties (SF).
|
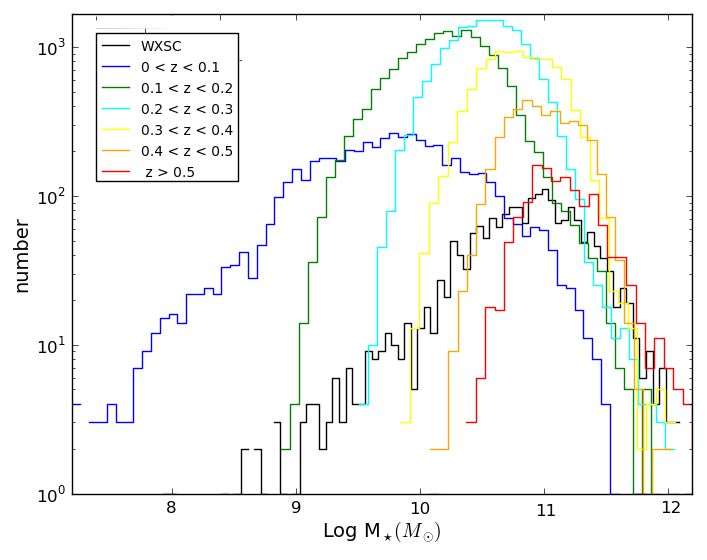
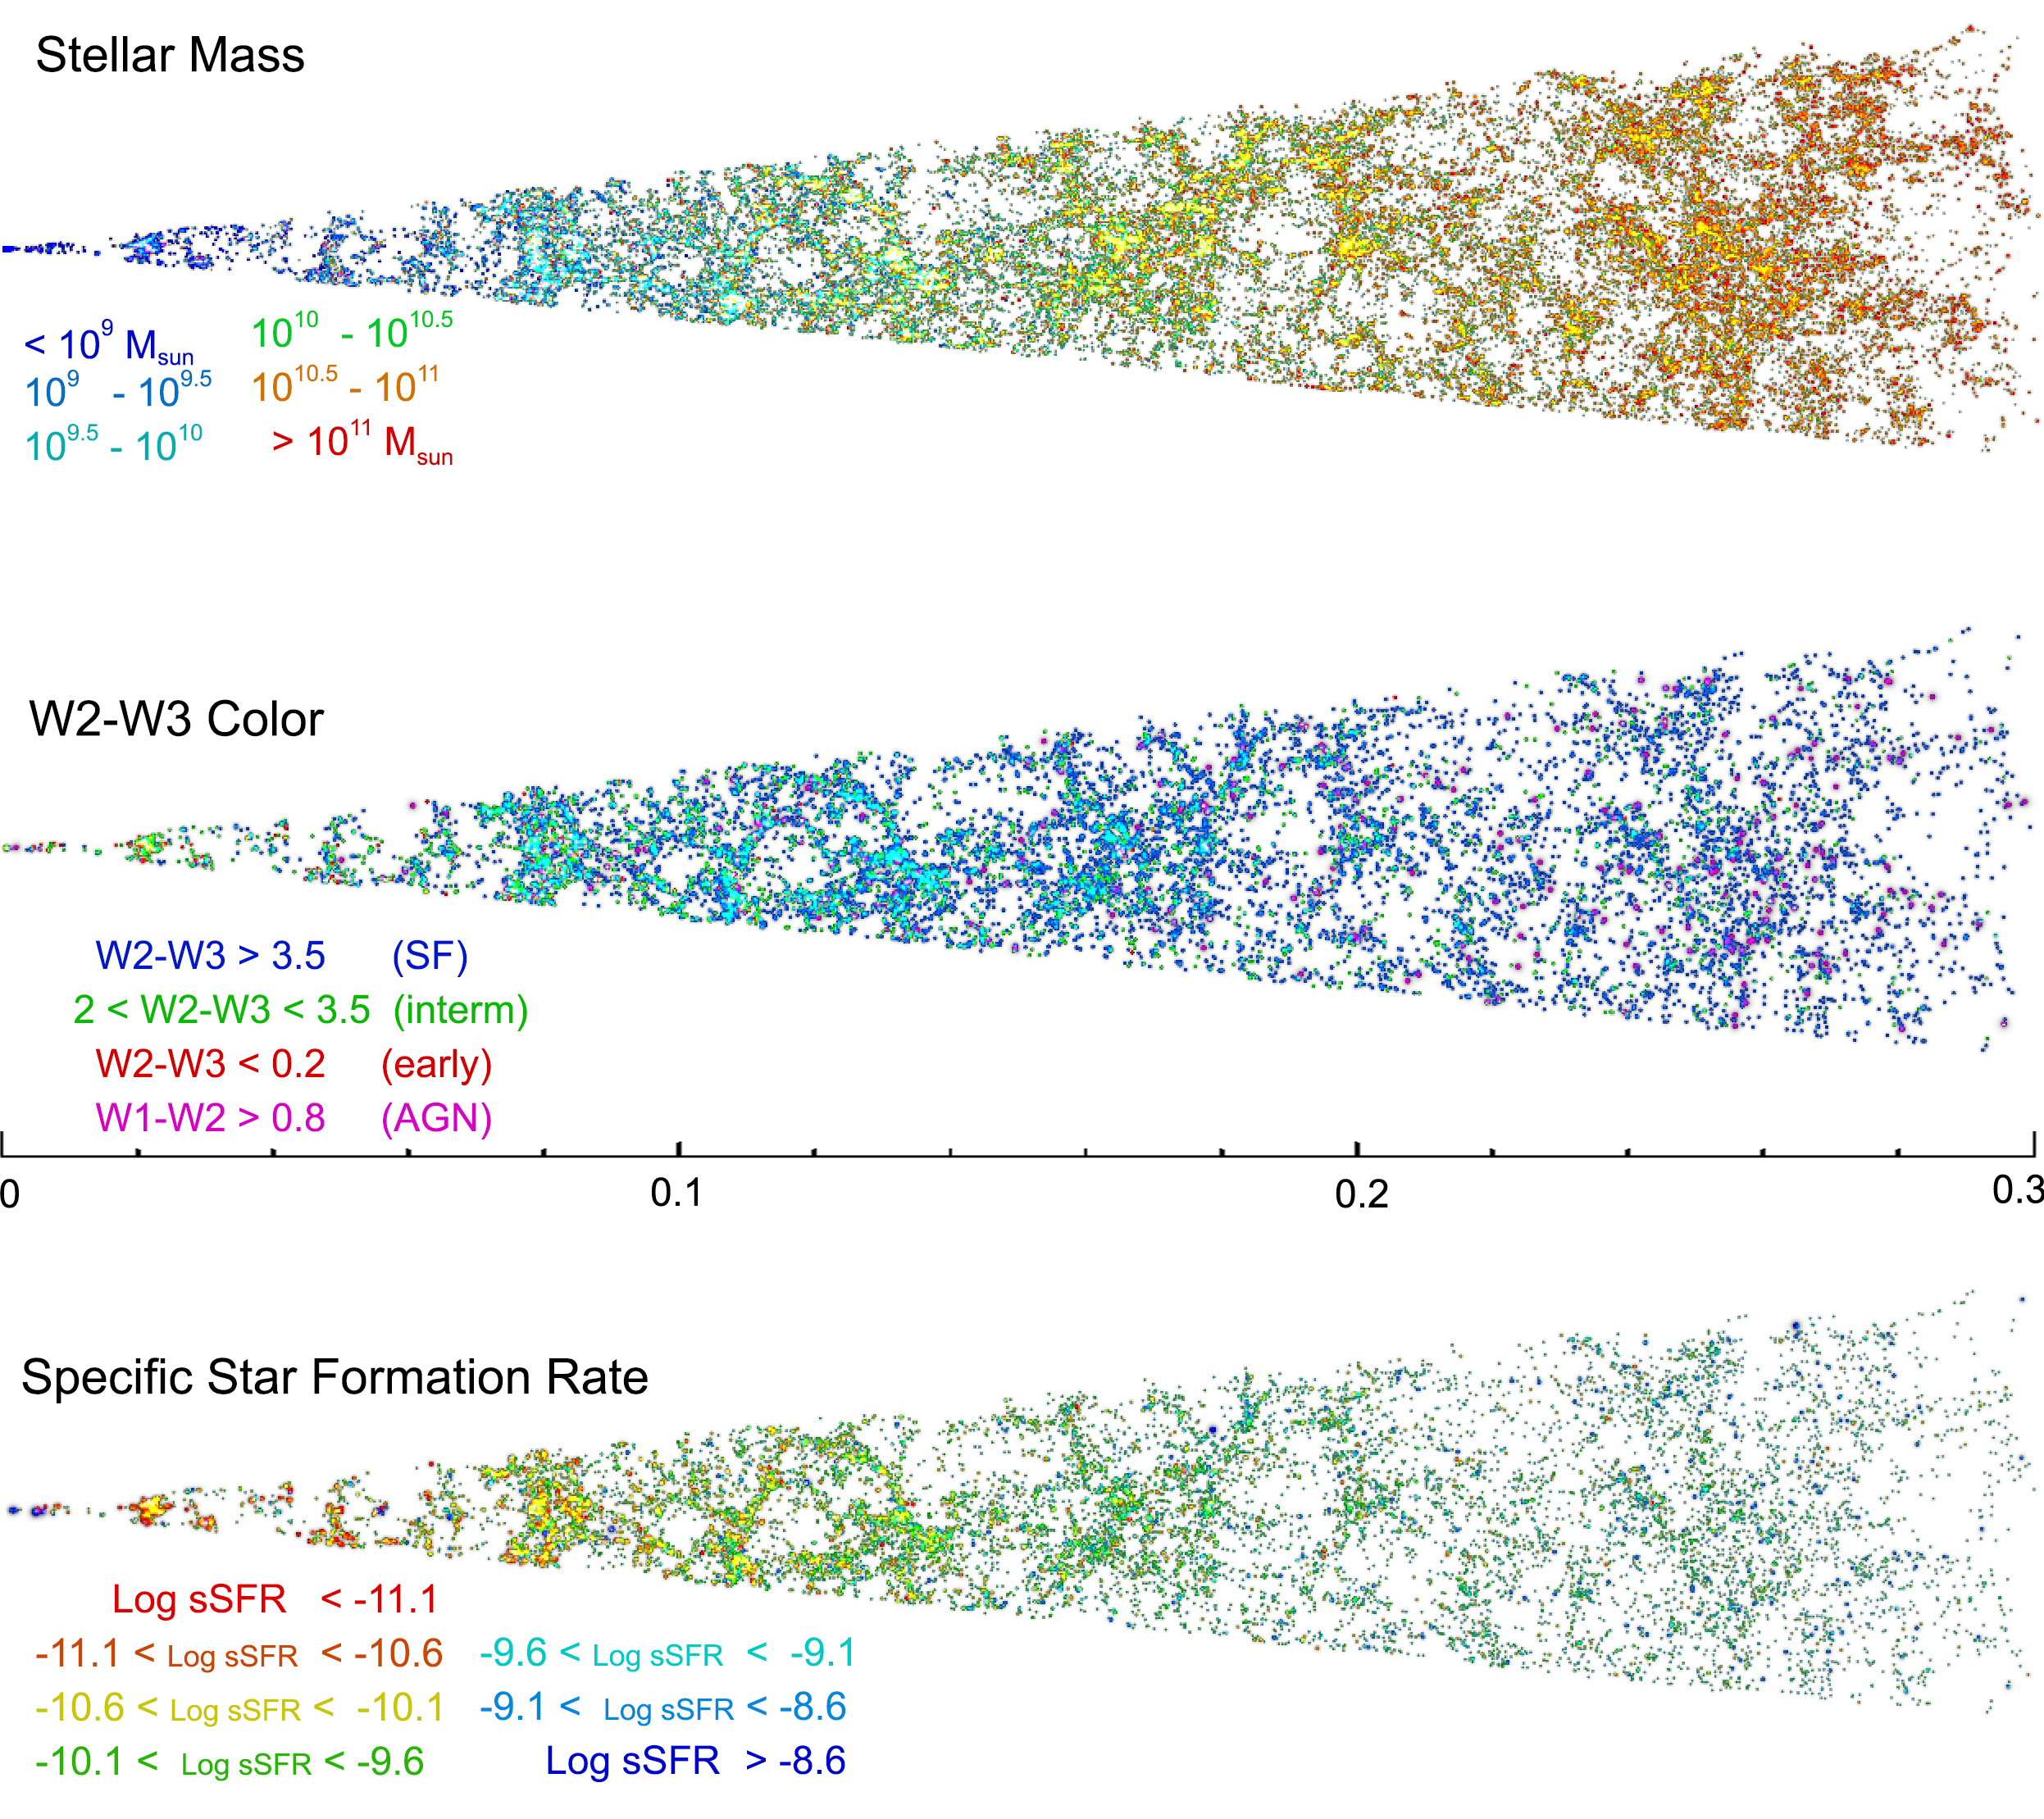
Stellar mass distribution in redshift shells. The lowest mass galaxies detected in GAMA, M* < 10^9 Msun, are only
seen at low redshifts (z < 0.1) because of the faint surface brightness, while the highest mass galaxies, > 10^11 Msun, are seen
well beyond the Local Universe. For redshift where GAMA is relatively complete, z < 0.3, the mass distribution peaks around > 10^10.5 Msun.
|
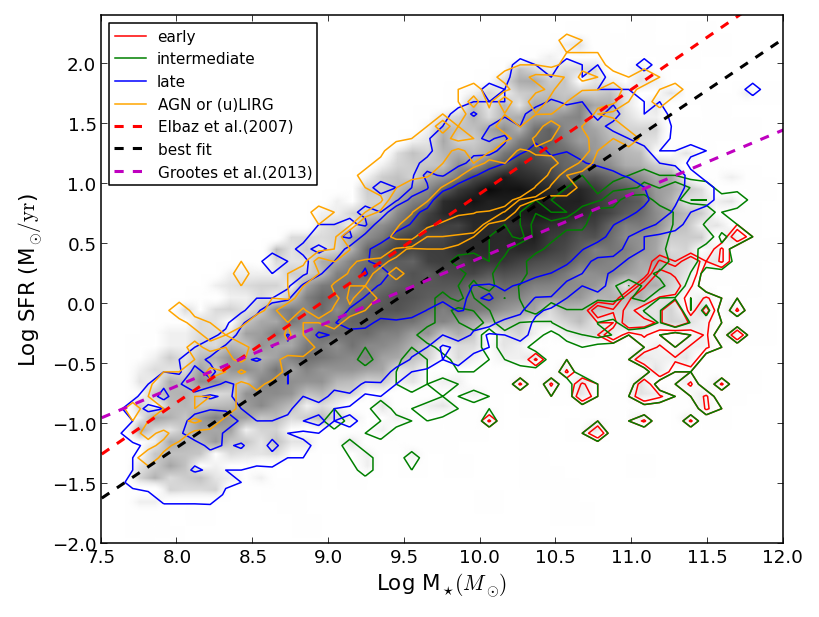
Star formation rate (SFR) relative to the host stellar mass, M* (Msun). The grey scale represents all sources with z < 0.3. The left panel (a) shows how the rate changes with mass, delineated by WISE color: early, intermediate, late and AGN and infrared-luminous types. The black dashed line represents the average `sequence for the sample; the magenta dotted line the relation at high redshift (Elbaz et al. 2007), and the dashed magenta line is for a nearby GALEX-GAMA sample (Grootes et al. 2013).
|
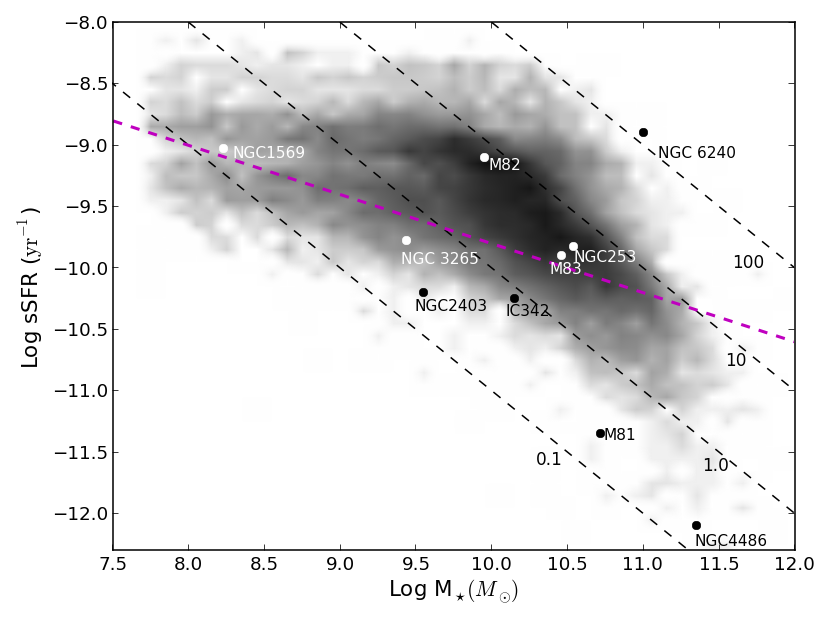
Mass-normalized, Specific Star Formation, with dashed lines representing lines of constant SFR (0.1, 1, 10 and 100 Msun yr-1), and the magenta dashed line the relation from Grootes et al. (2013).
For comparison, a few nearby galaxies values are indicated, from massive spheroidal (NGC4486; M87) to star-forming (NGC 253) spirals and starbursts (M82), and to dwarfs (NGC1569).
|
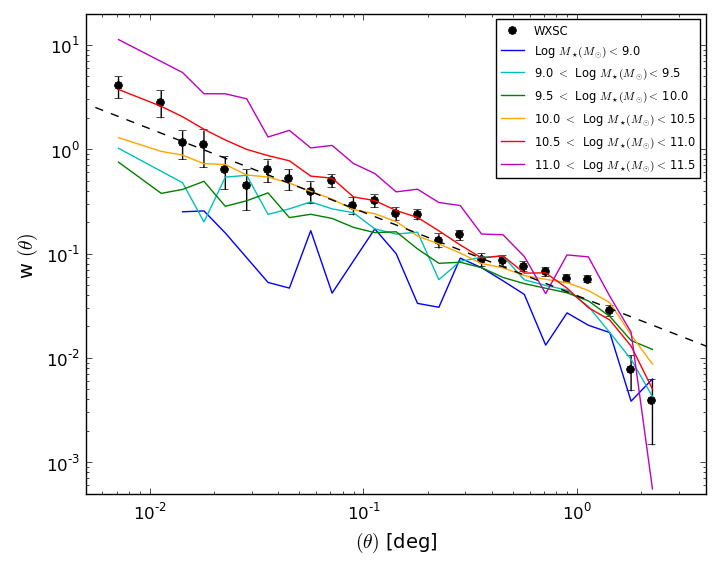
Galaxy two-point angular correlation function for stellar mass. For comparison, we also show the result for WISE resolved sources (WXSC) including their 1-sigma uncertainties (filled points and bars). The dashed line represents a power law of index -0.8.
|
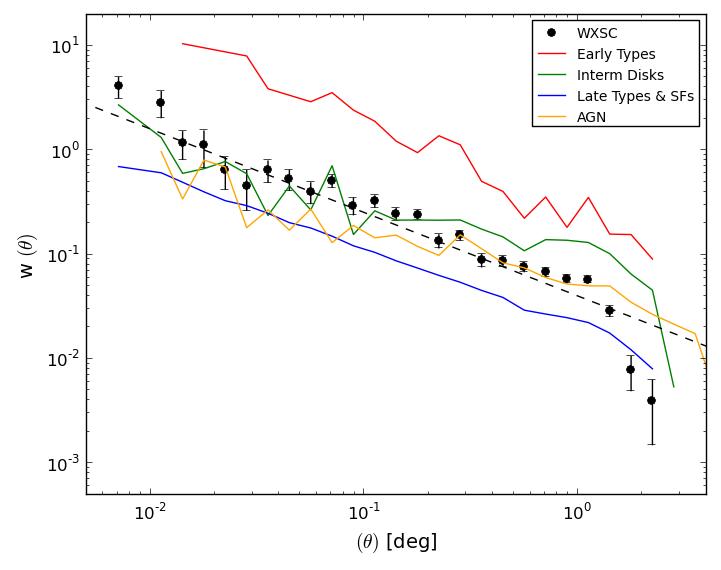
Galaxy two-point angular correlation function for color or morphology. For comparison, we also show the result for WISE resolved sources (WXSC) including their 1-sigma uncertainties (filled points and bars). The dashed line represents a power law of index -0.8.
For color separation, the plane W2-W3 vs. W1-W2 is used to separate galaxy type.
|
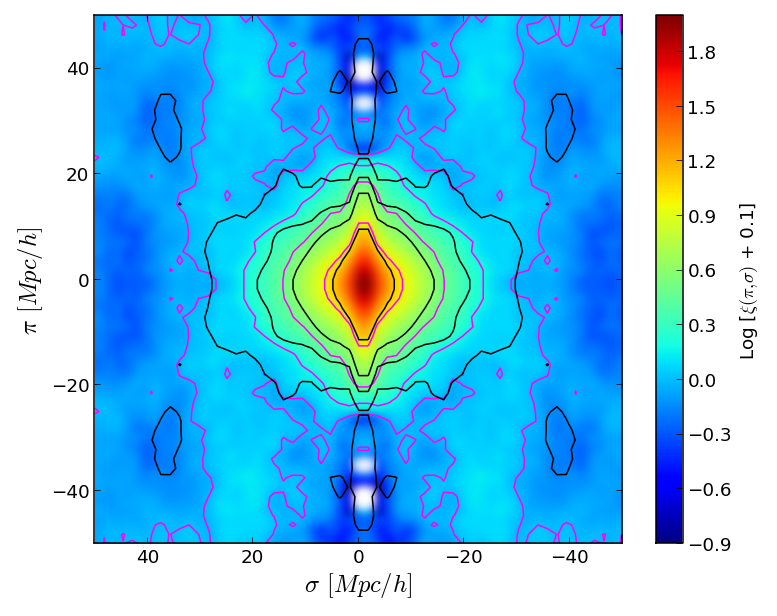
3D two-point correlation function of the G12 galaxy distribution.
2PCF in the pi (parallel) vs. sigma (perpendicular) plane. Here we compare two redshift families: 0.1 < z < 0.3 (black contours) and 0.3 < z < 0.5 (background grey-scale and magenta contours). The contour levels are the same for both; 0.05, 0.12, 0.29. 0.71 171, 4.1, 10. The elongation along the sigma = 0 axis is due to `finger of god'
redshift distortion, inducing a negative correlation (white space).
|
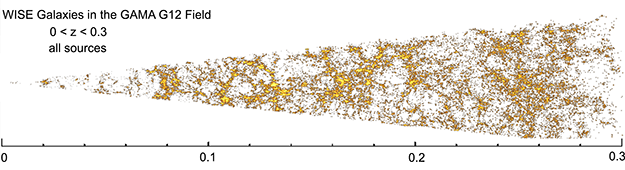
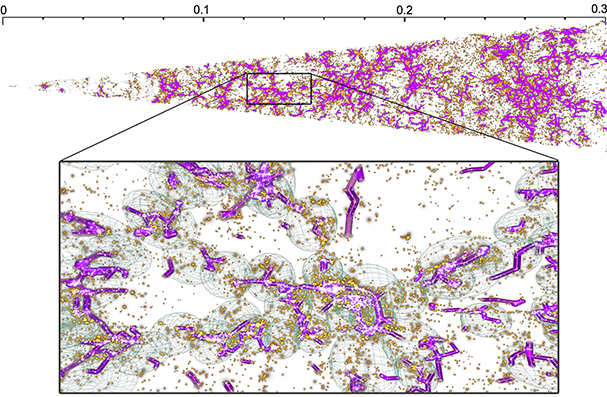
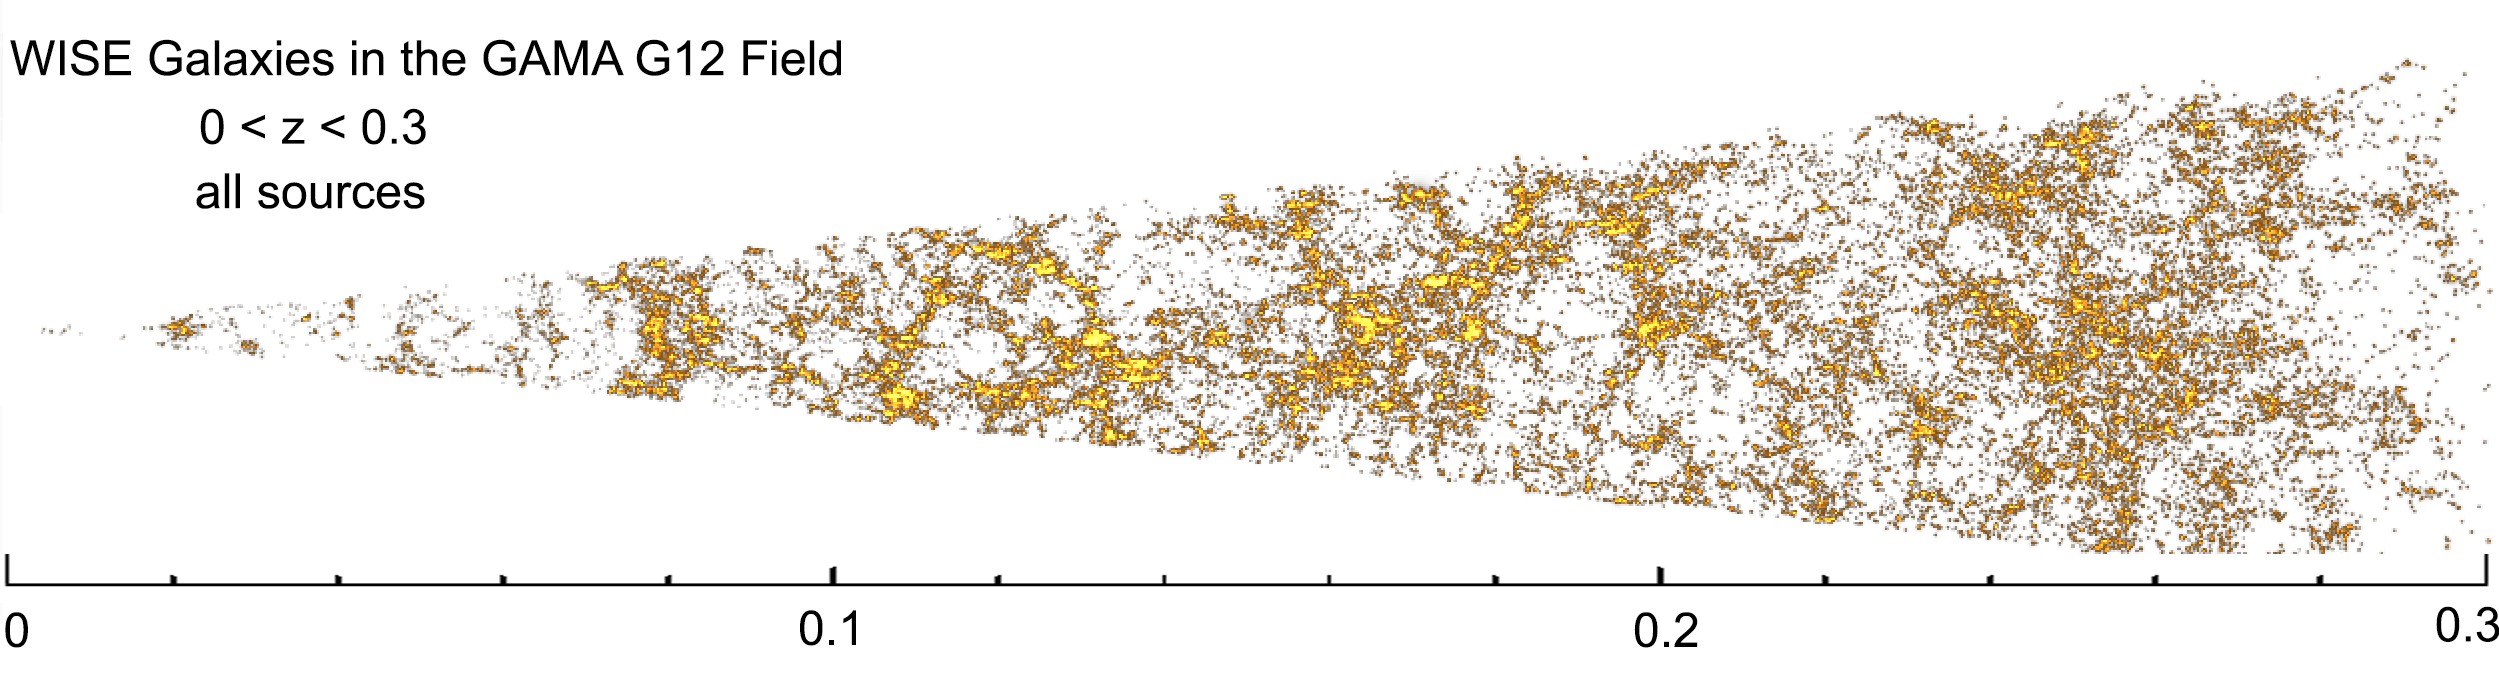
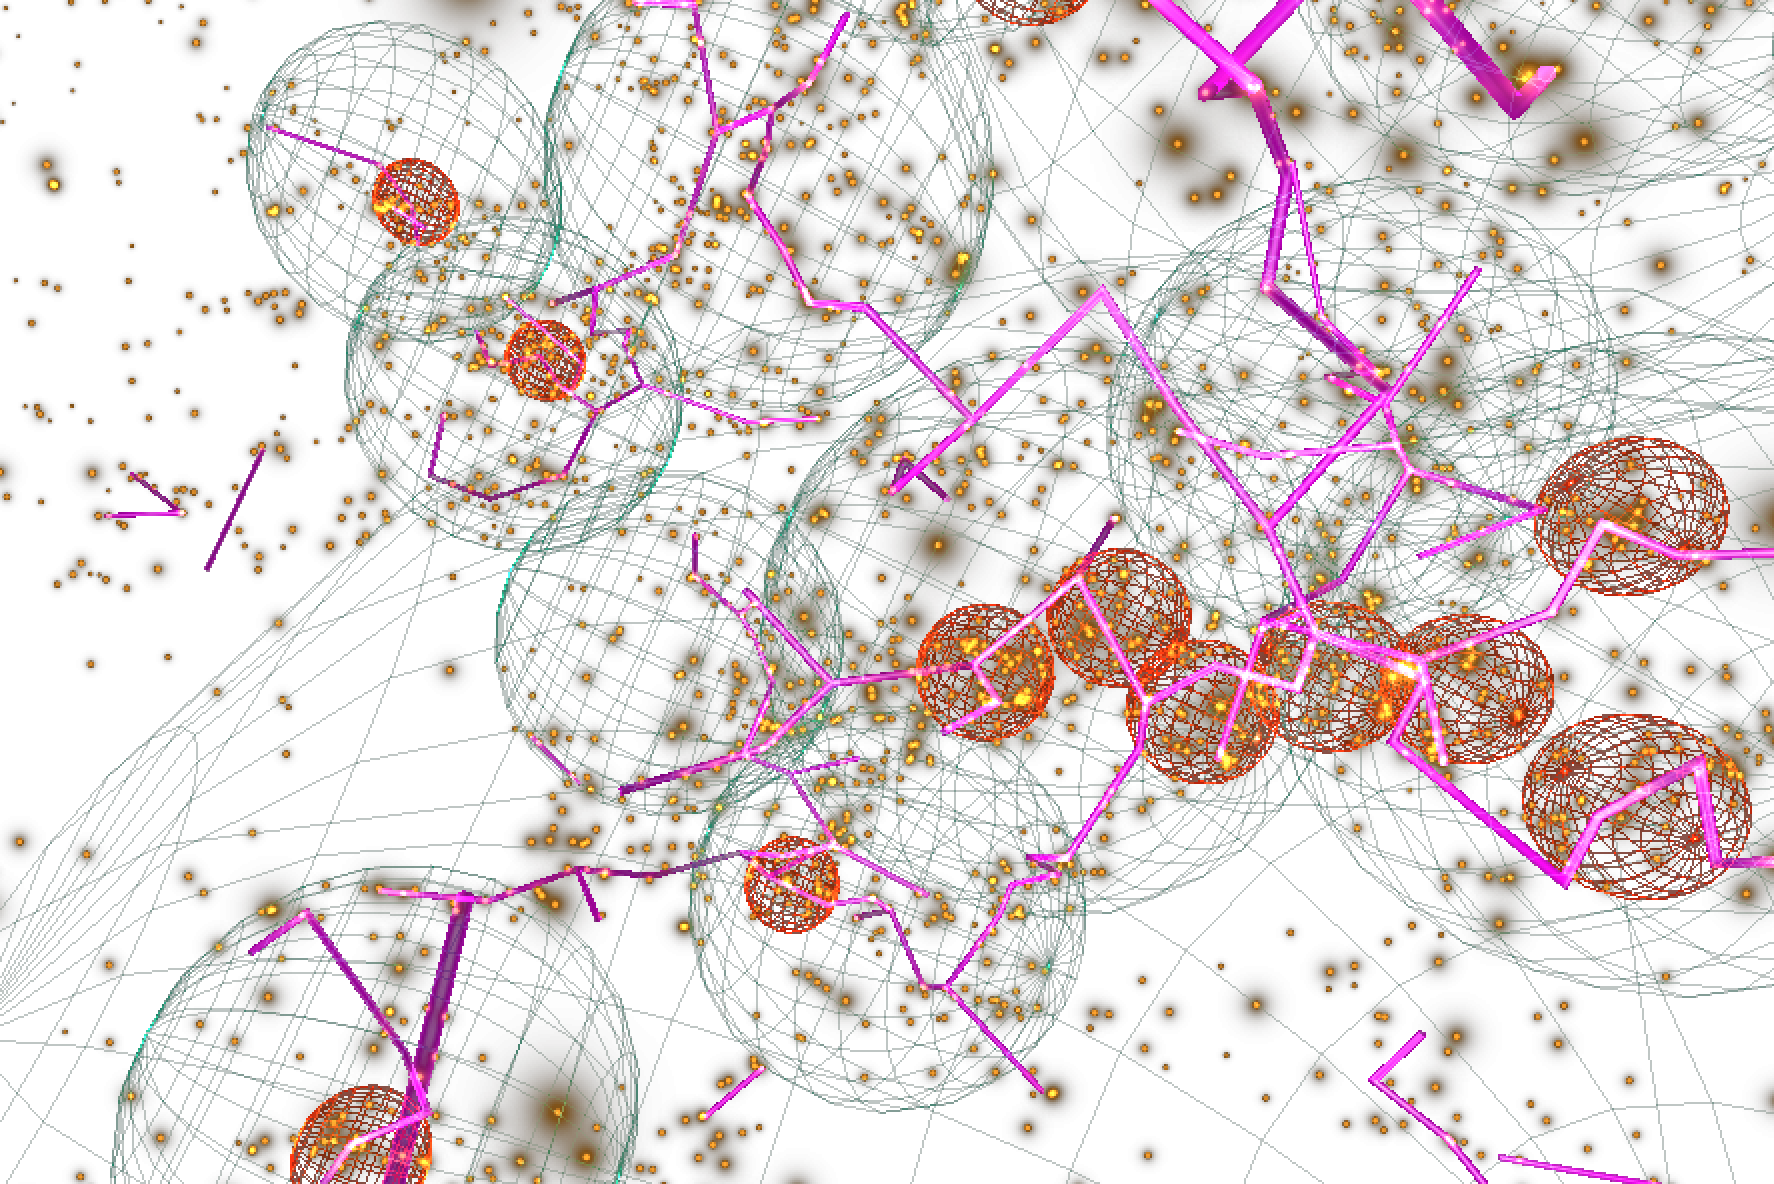
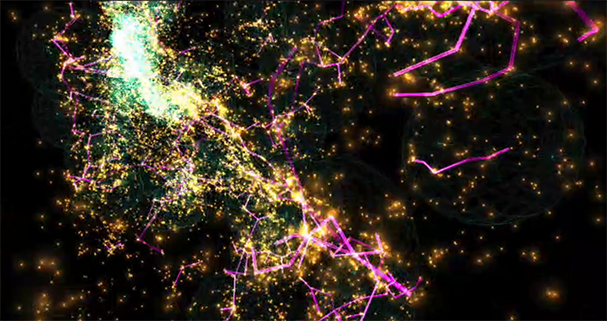
WISE-GAMA galaxies in G12, displayed using a 3D cone that extends to a redshift of 0.3, or a luminosity distance of 1564 Mpc (1200 Mpc in co-moving frame), and a total co-moving volume of 0.011 Gpc3. The lower panel shows the same view, but with the GAMA galaxy groups filament catalog (Alpaslan et al. 2015) overlayed in magenta, illustrating the underlying `skeleton' of the web of galaxies. The inset image shows a zoomed view of an over-density region near z ~ 0.14 to gain a better view of the 3D distribution of filaments and clusters. The green spheres are the over-dense regions determined in a 20 Mpc diameter region. The graphics were made using the Partiview visualization system.
|
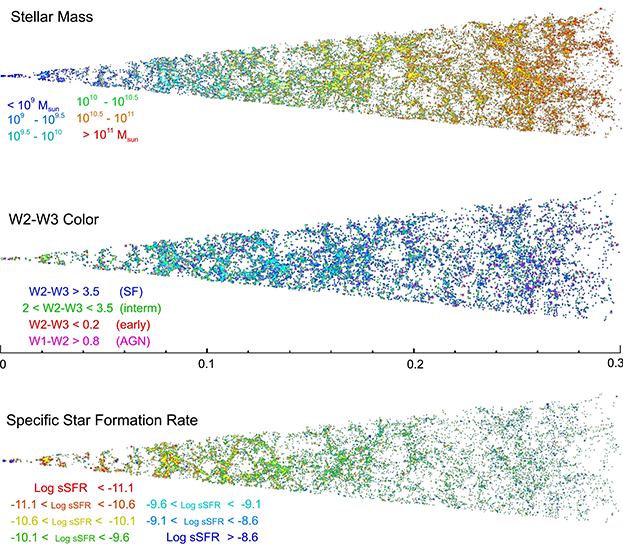
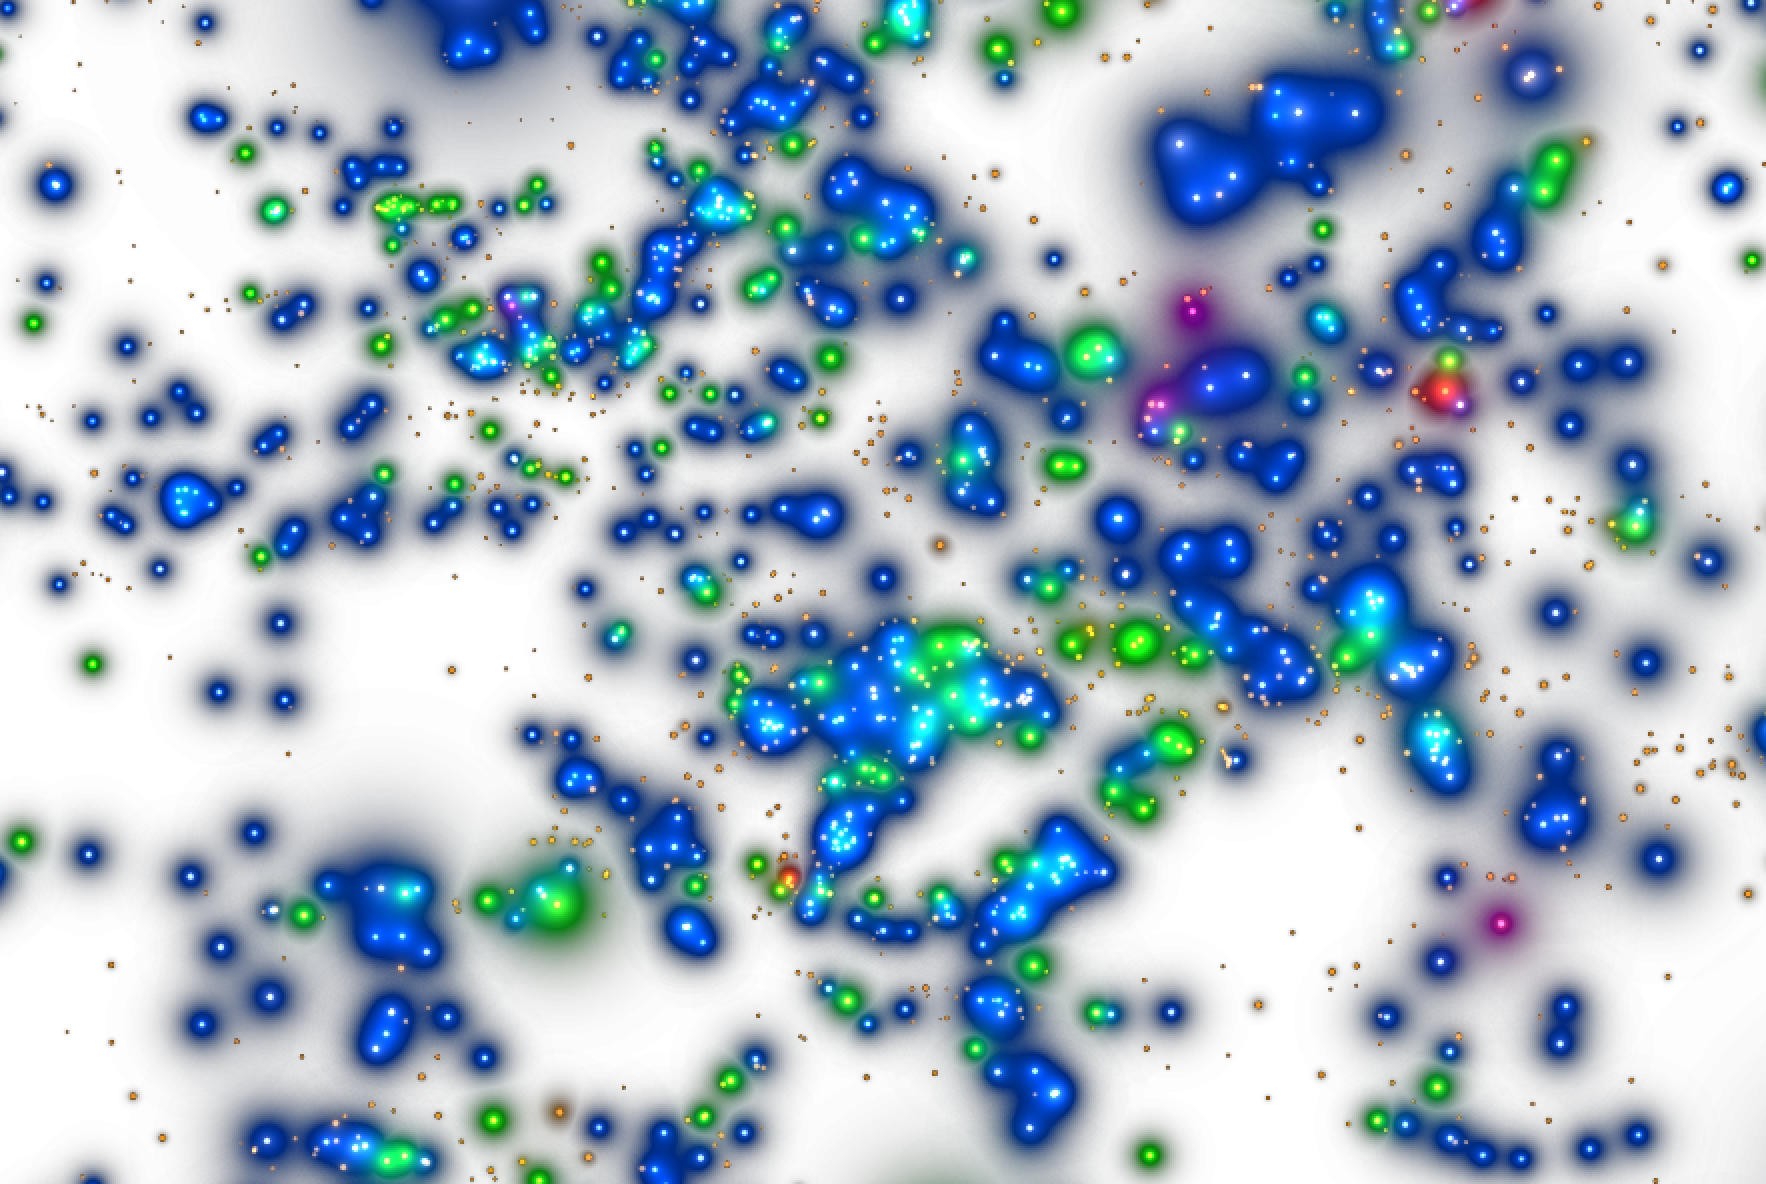
Three different views of the spatial cone distribution of WISE galaxies in G12. The upper panel is color-coded by the stellar mass (compare with Figure 11b), the middle panel by the WISE W2-W3 color, a proxy for morphological type: delineating early (spheroidal), intermediate (disks) and late-types (disks), and the bottom panel by the Specific Star Formation Rate.
|